
The History of Maps and Cartography: From Ancient Sketches to Digital Precision
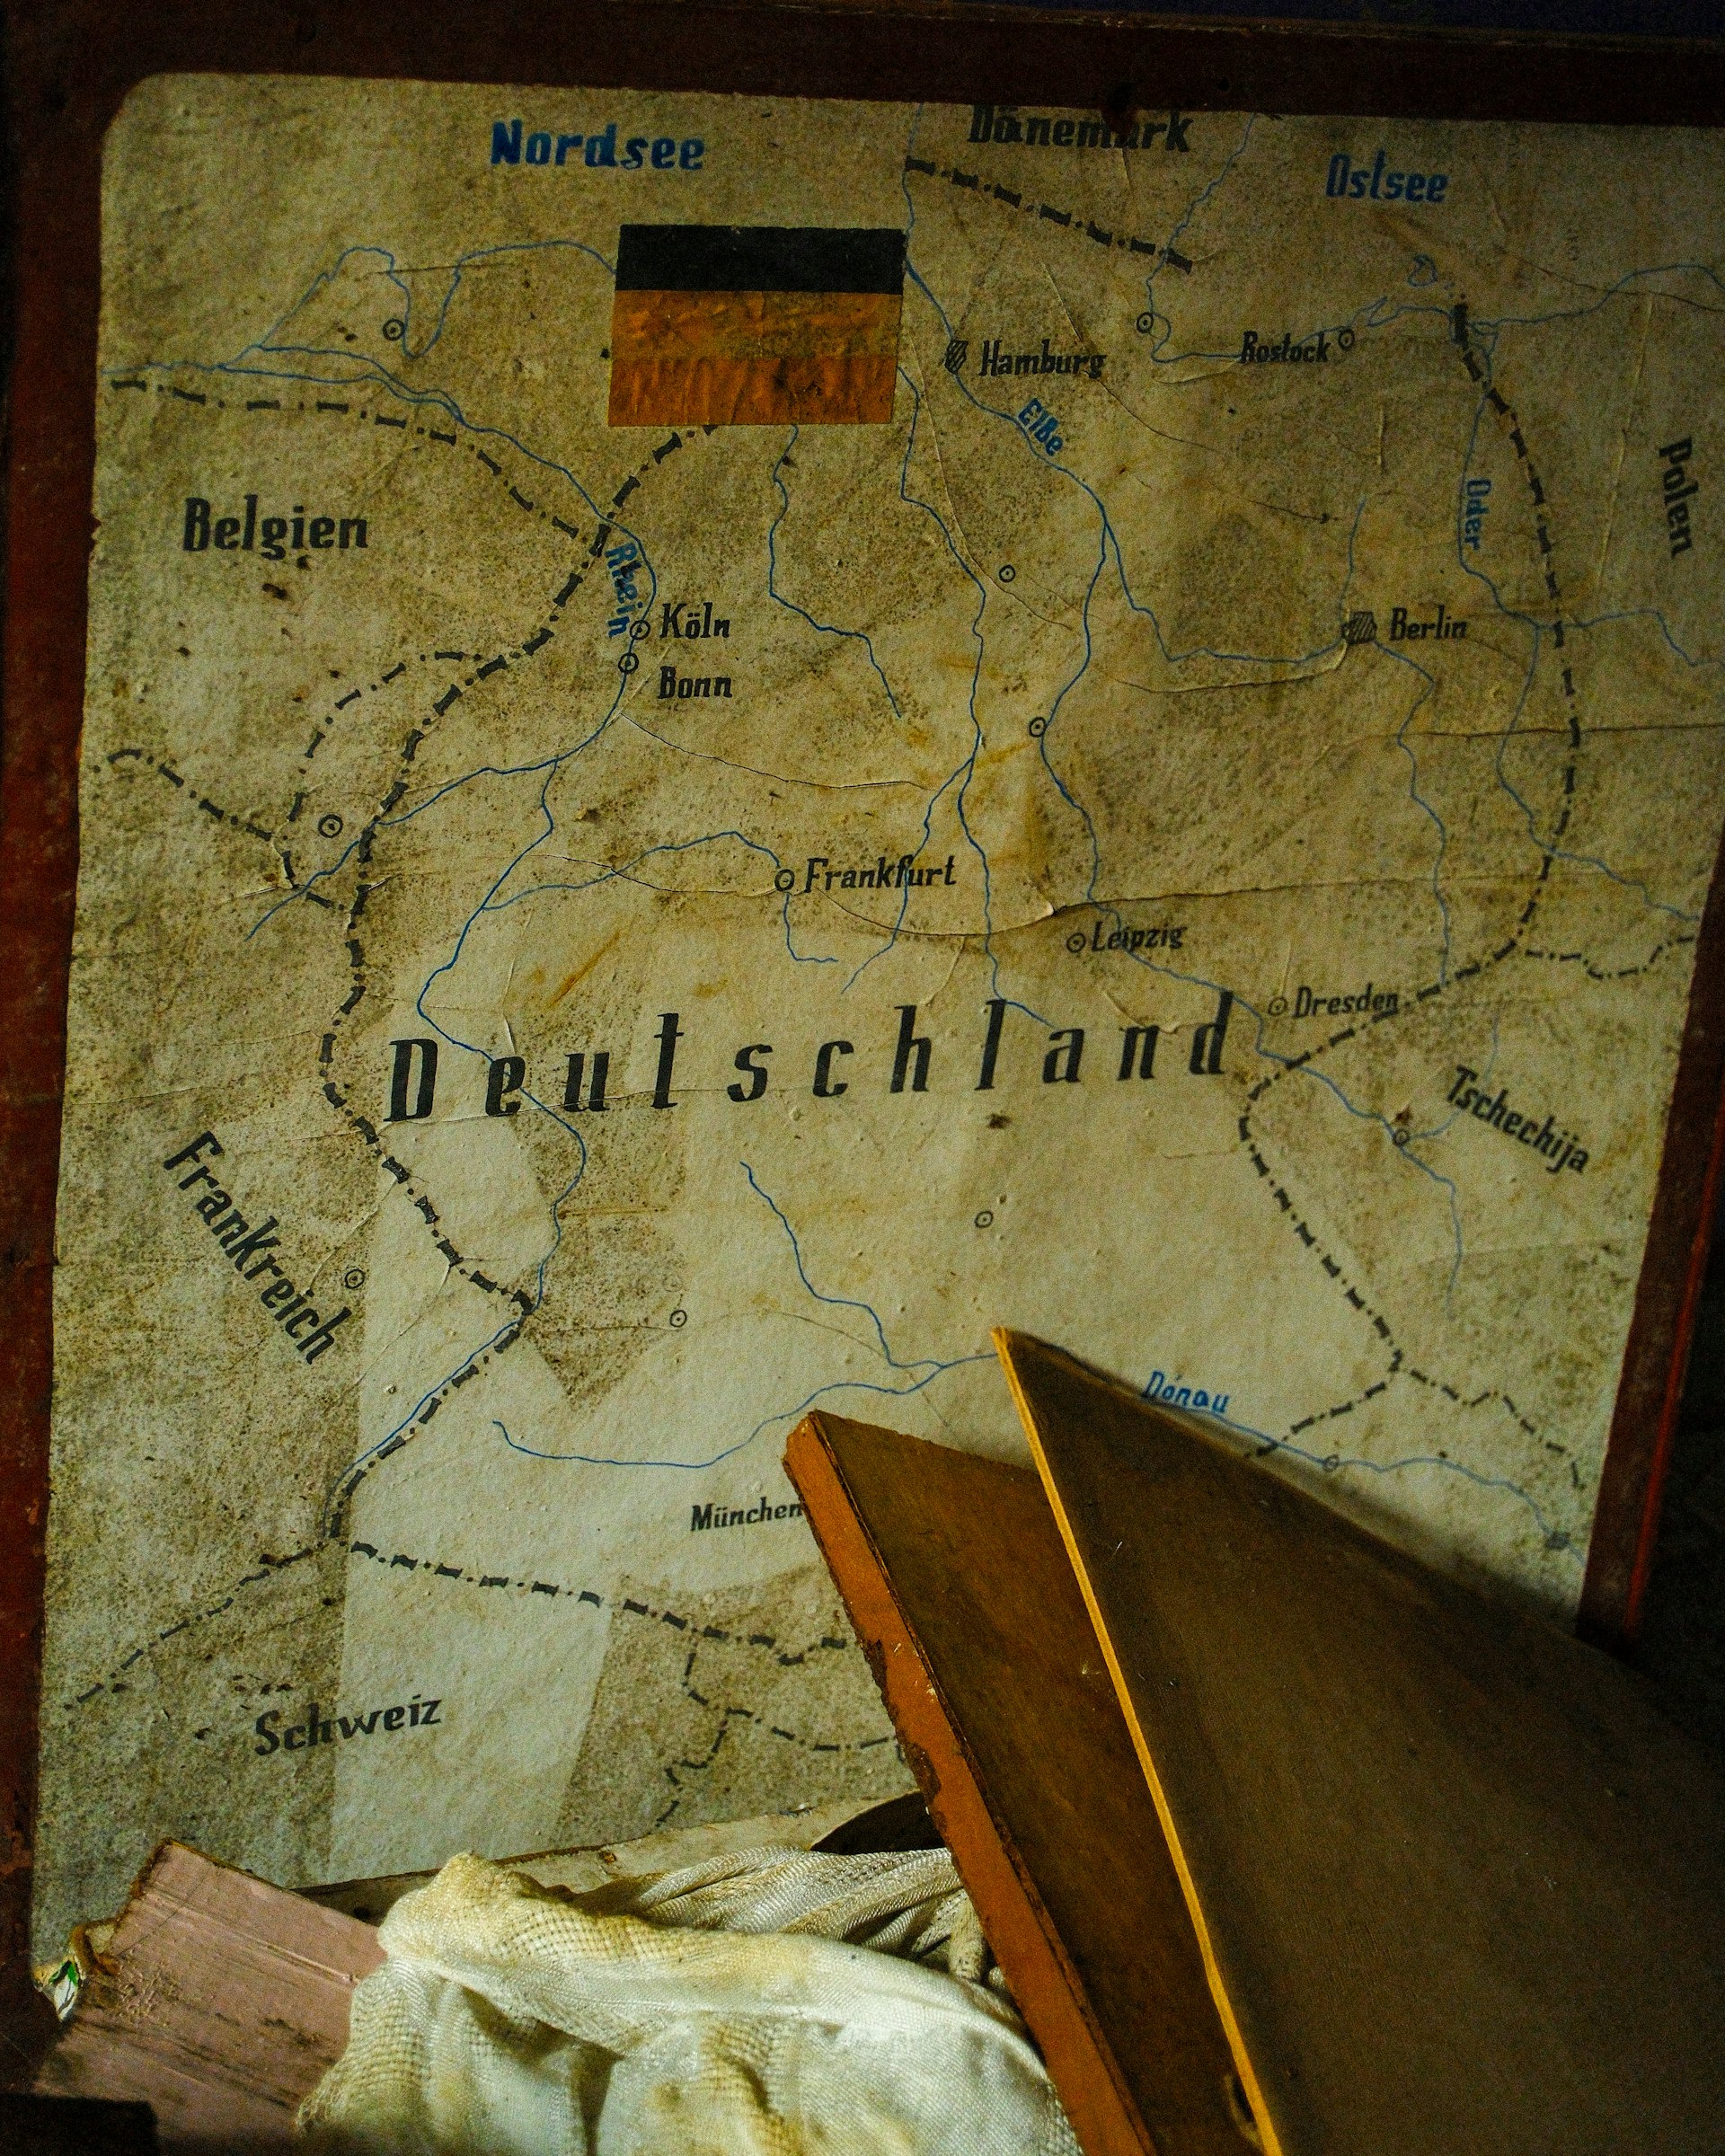

Photo by Eugene Chystiakov on Unsplash
Ancient Origins of Cartography
Maps emerged as one of humanity’s earliest tools for representing space, with the oldest known examples dating back to around 2300 BC. These primitive maps, often etched on clay tablets in ancient Babylon, depicted local landscapes, rivers, and settlements for practical purposes like agriculture and land division [1] [5] . Unlike modern maps, early versions ignored Earth’s curvature because mapmakers focused on small areas where such factors were negligible, and the spherical nature of the planet was unknown [1] .
In ancient civilizations like Greece, Rome, China, and India, cartography advanced significantly. Chinese texts from the Zhou dynasty era, such as the *Rites of Zhou* (first recorded around 130 BC), described maps for governmental provinces, frontiers, and resource locations like ores for mining. By 117 BC, Emperor Wu of Han required empire-wide maps upon investitures [1] . These maps, drawn on silk or paper, supported administration and military strategy. In Greece, Anaximander is credited with creating the first world map around 550 BC, portraying Earth as a cylinder-a conceptual leap despite its inaccuracies [2] .
Practical applications drove these developments. For instance, Roman itineraria picta, like the Peutinger Map, illustrated road networks for travelers and legions, prioritizing routes over scale. To study ancient maps today, researchers can consult digitized collections from institutions like the British Library or search academic databases for ‘ancient Babylonian maps’ or ‘Chinese silk maps Han dynasty.’ Challenges included material fragility-clay and papyrus degraded-but replicas and archaeological finds preserve this legacy [1] .
Classical Advancements and Ptolemy’s Revolution
The true birth of systematic cartography is often attributed to Claudius Ptolemy in the 2nd century CE. His seminal work, *Geographia*, introduced latitude and longitude coordinates, cataloged thousands of locations, and pioneered perspective projection to represent the globe on flat surfaces [2] . This addressed distortion issues inherent in projecting a sphere onto a plane, apportioning inaccuracies systematically [1] .
Ptolemy’s influence endured through the Middle Ages. Arab cartographer Muhammad al-Idrisi built on this in 1154 with the *Tabula Rogeriana*, a highly accurate world map incorporating Greek, Arab, and personal observations. It detailed geography, cultures, economies, and natural features, serving as a standard for travelers [2] [3] . Meanwhile, portolan charts-detailed sea maps with rhumb lines for navigation-emerged in the Mediterranean, aiding maritime trade.
To replicate Ptolemy’s methods, one could start by plotting coordinates on graph paper, understanding conic projections for mid-latitudes. Modern enthusiasts might use free software like QGIS to recreate *Geographia* maps. Potential pitfalls include coordinate errors from ancient astronomy, solvable by cross-referencing with satellite data. Alternatives involved T-O maps, symbolic medieval designs depicting known world as a circle (O) around Jerusalem (T for rivers) [3] .
Chinese Innovations and Dynastic Mapping
China’s cartographic tradition was remarkably advanced and bureaucratic. During the Sui dynasty (581-618), Pei Ju created a geometrically gridded map in 605, while Emperor Yang commissioned provincial gazetteers with maps in 610 [1] . The Song dynasty (960-1279) saw massive projects, like Lu Duosun’s 1010 compilation of 1566 *Tu Jing* chapters updating regional maps.
By the Ming dynasty, Luo Hongxian’s 1579 *Guang Yutu* atlas featured over 40 gridded maps incorporating Zheng He’s voyages to Africa, systematically marking landmarks [1] . Stone steles from the Liang dynasty (502-557) preserved maps durably. These efforts supported governance, taxation, and exploration. To access replicas, search library catalogs for ‘Sui dynasty Pei Ju map’ or visit the Palace Museum in Beijing’s digital archives.
Challenges like vast territory were met with standardized grids, precursors to modern GIS. Step-by-step: gather provincial data, grid coordinates, layer features. Alternatives included painted silk scrolls for portability. This tradition highlights cartography’s role in empire management [1] .
Renaissance, Age of Exploration, and Printing Press
The 15th century ignited cartographic explosion via rediscovered classics, printing, and exploration. Gutenberg’s press enabled mass reproduction, standardizing knowledge [5] . Portuguese voyages and Italians advanced nautical charts; copperplate engraving replaced woodcuts for detail [3] .
Juan de la Cosa’s 1500 map showed Americas’ coastlines post-Columbus. Gerardus Mercator’s 1569 projection, with straight-line rhumb lines, revolutionized navigation despite polar distortions [2] [5] . To apply: plot lat/long on cylindrical grid, adjust for navigation. Tools like Leaflet.js allow digital versions. Issues like size exaggeration near poles are mitigated by alternatives like Robinson projection.
Enlightenment, Industrial Revolution, and National Surveys
18th-century monarchs commissioned precise surveys: France’s Cassini family mapped the kingdom; Habsburgs charted Netherlands via Ferraris; Britain’s Ordnance Survey began in 1791, detailing every yard by 1835 [4] [3] . James Cook advanced marine cartography.
Lithography and zincography improved color printing. Belgium’s Dépôt de la Guerre issued 1:20,000 maps by 1860. Baedeker’s tourist maps integrated ads [4] . Steps for surveys: triangulate points, field verify, lithograph. Challenges: terrain access, solved by teams.

Photo by Bernd 📷 Dittrich on Unsplash
Modern and Digital Cartography
20th century brought aerial photography, satellites, and GIS. Google Earth democratized access [1] . Erwin Raisz’s landform drawings exemplified artistry [10] . Today, AI enhances projections.
To create modern maps: use QGIS or ArcGIS, import satellite data, apply projections. Explore timelines via RISD Library or Marginalian collections [8] [7] .
References
[1] Wikipedia: History of Cartography (2023). Comprehensive timeline from ancient to modern maps.
[2] History Guild: Mapping the World (n.d.). Overview of key cartographers like Ptolemy and al-Idrisi.
[4] Fire & Pine: A Brief History of Maps (n.d.). Industrial Revolution and Ordnance Survey details.
[5] Atlas.co: History of Cartography (n.d.). Early maps to Renaissance projections.
[7] The Marginalian: Cartographies of Time (2012). Visual history of timelines.
[8] RISD Fleet Library: Maps & Mapping Historic Timelines (n.d.). Resources on historic maps.
[10] Making Maps: Raisz’s History (2007). American cartography timelines.